A/B Testing

An A/B test is an experiment in which two or more versions (A and B) of a webpage (or another interface) are compared to determine which one performs better in achieving a specific goal.

  • Role: UX Researcher
  • Context: Statistical Testing
  • Duration: March 2024

The Project

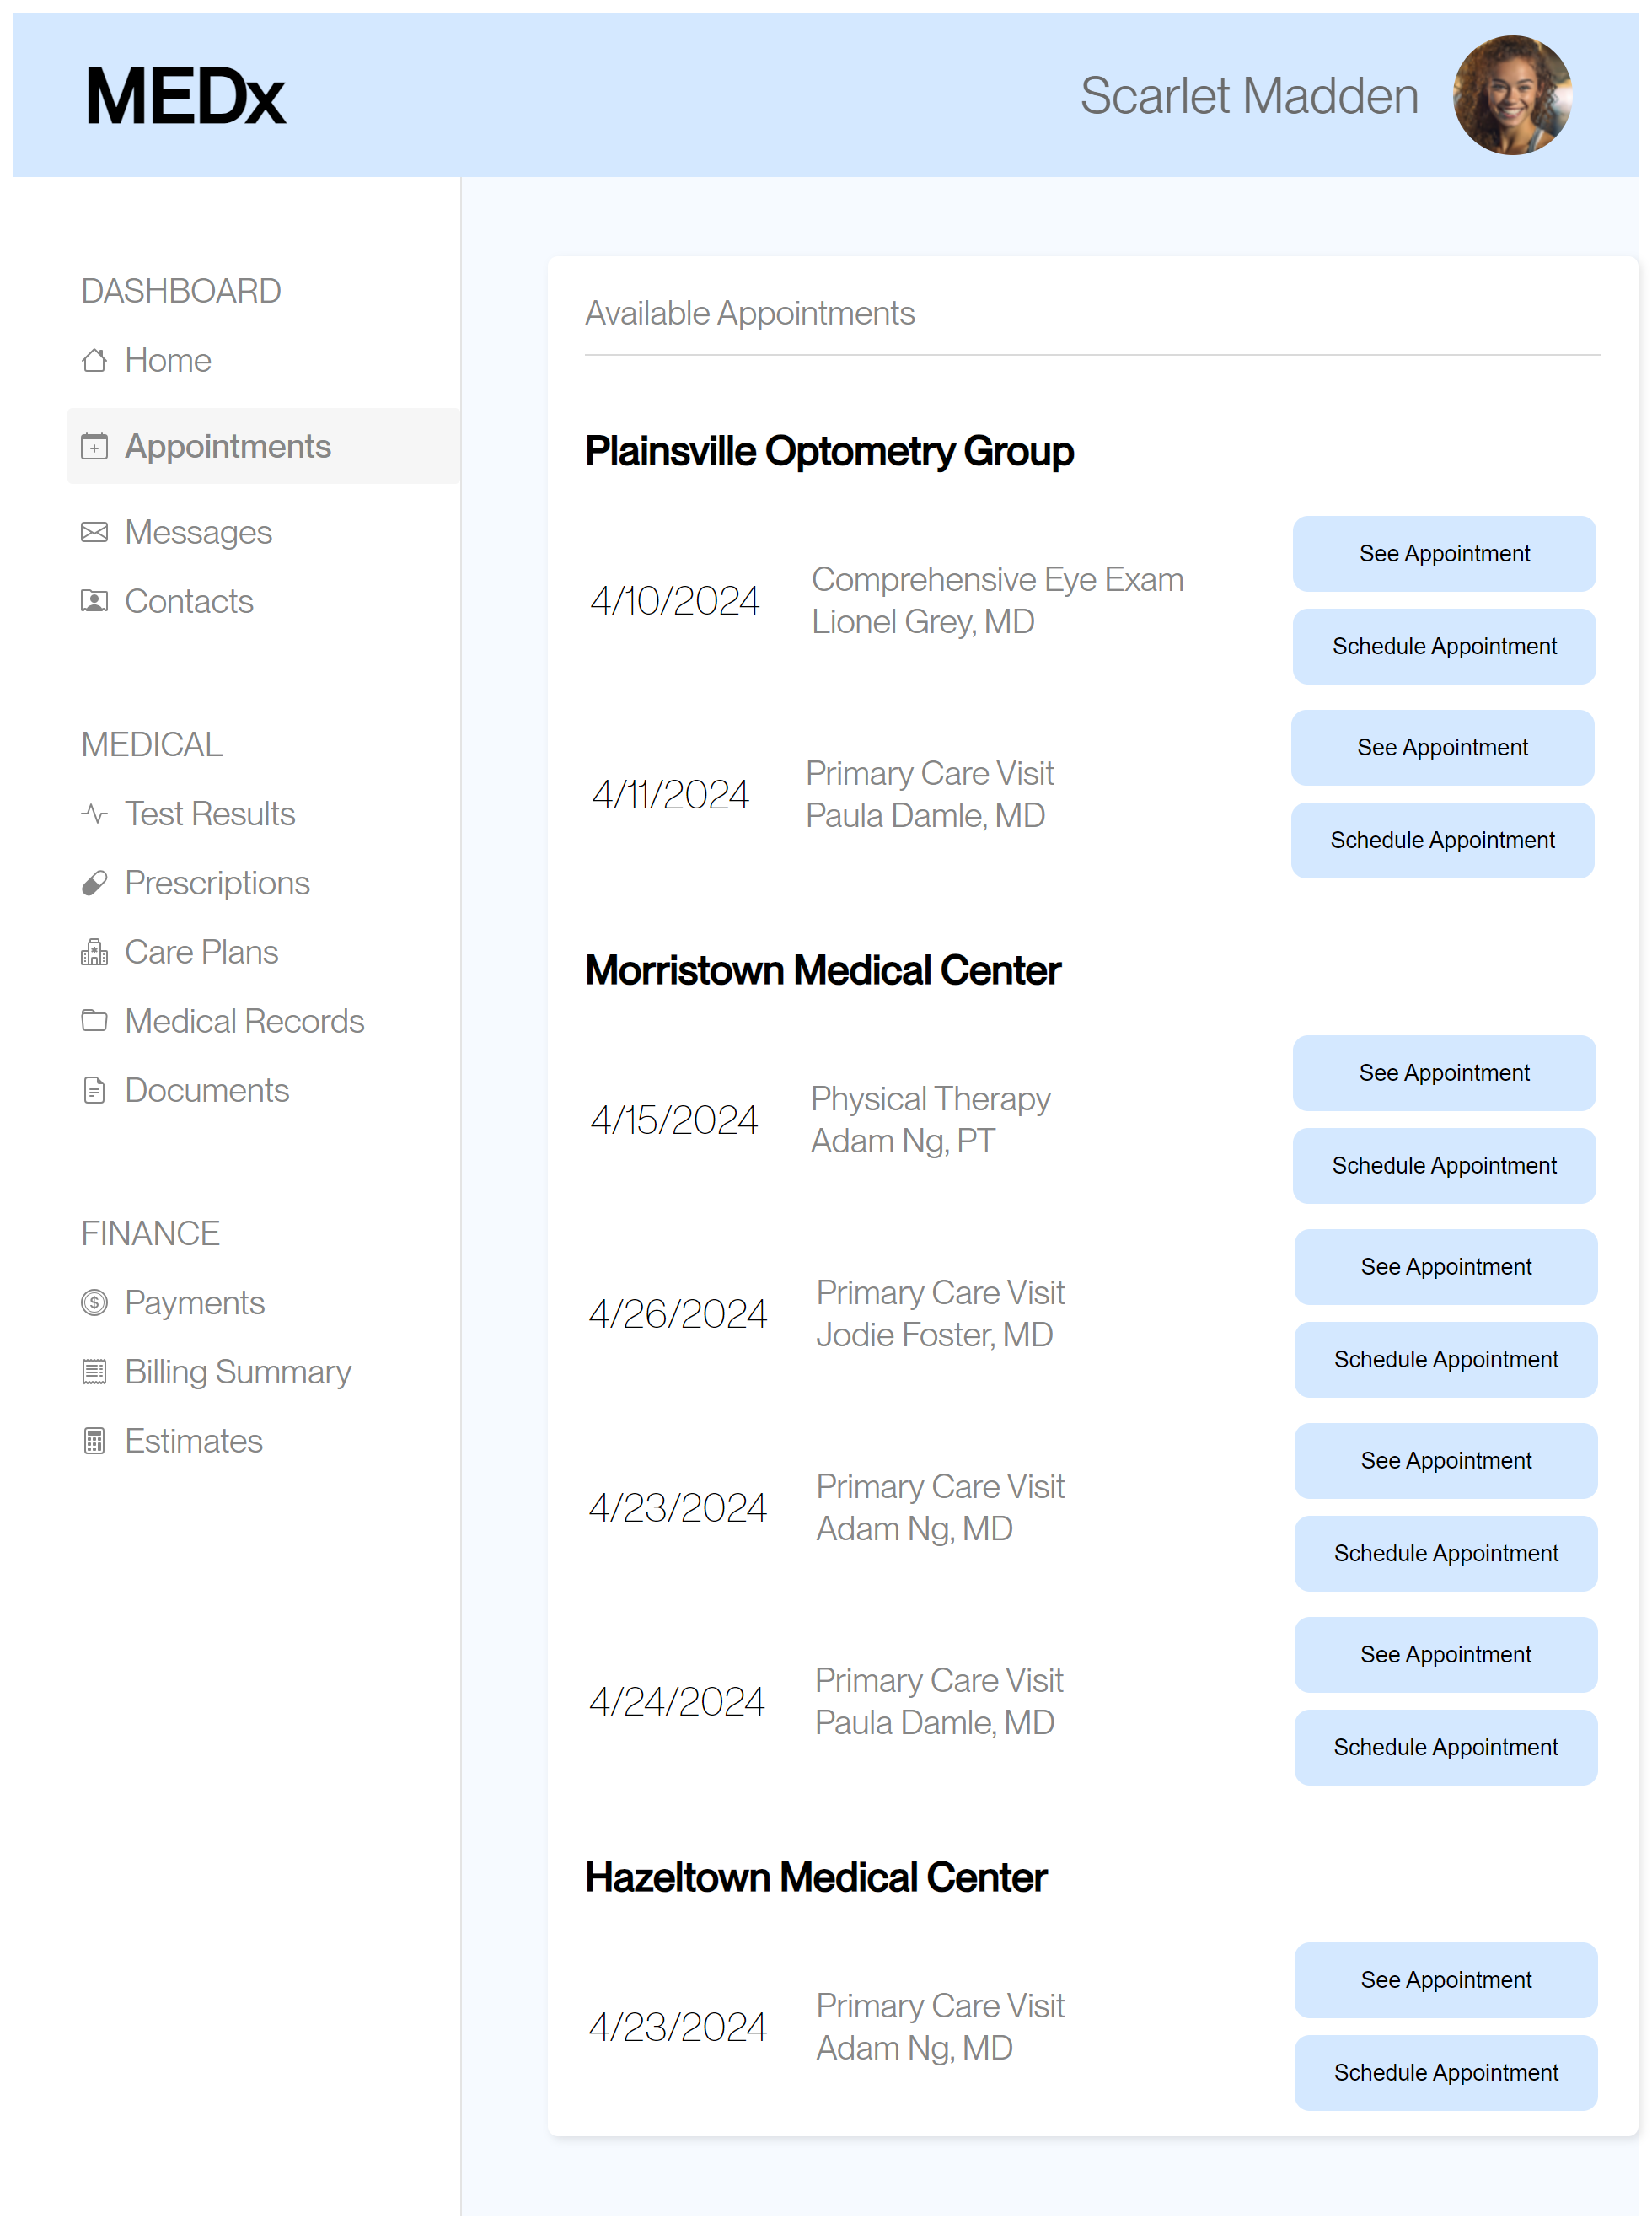
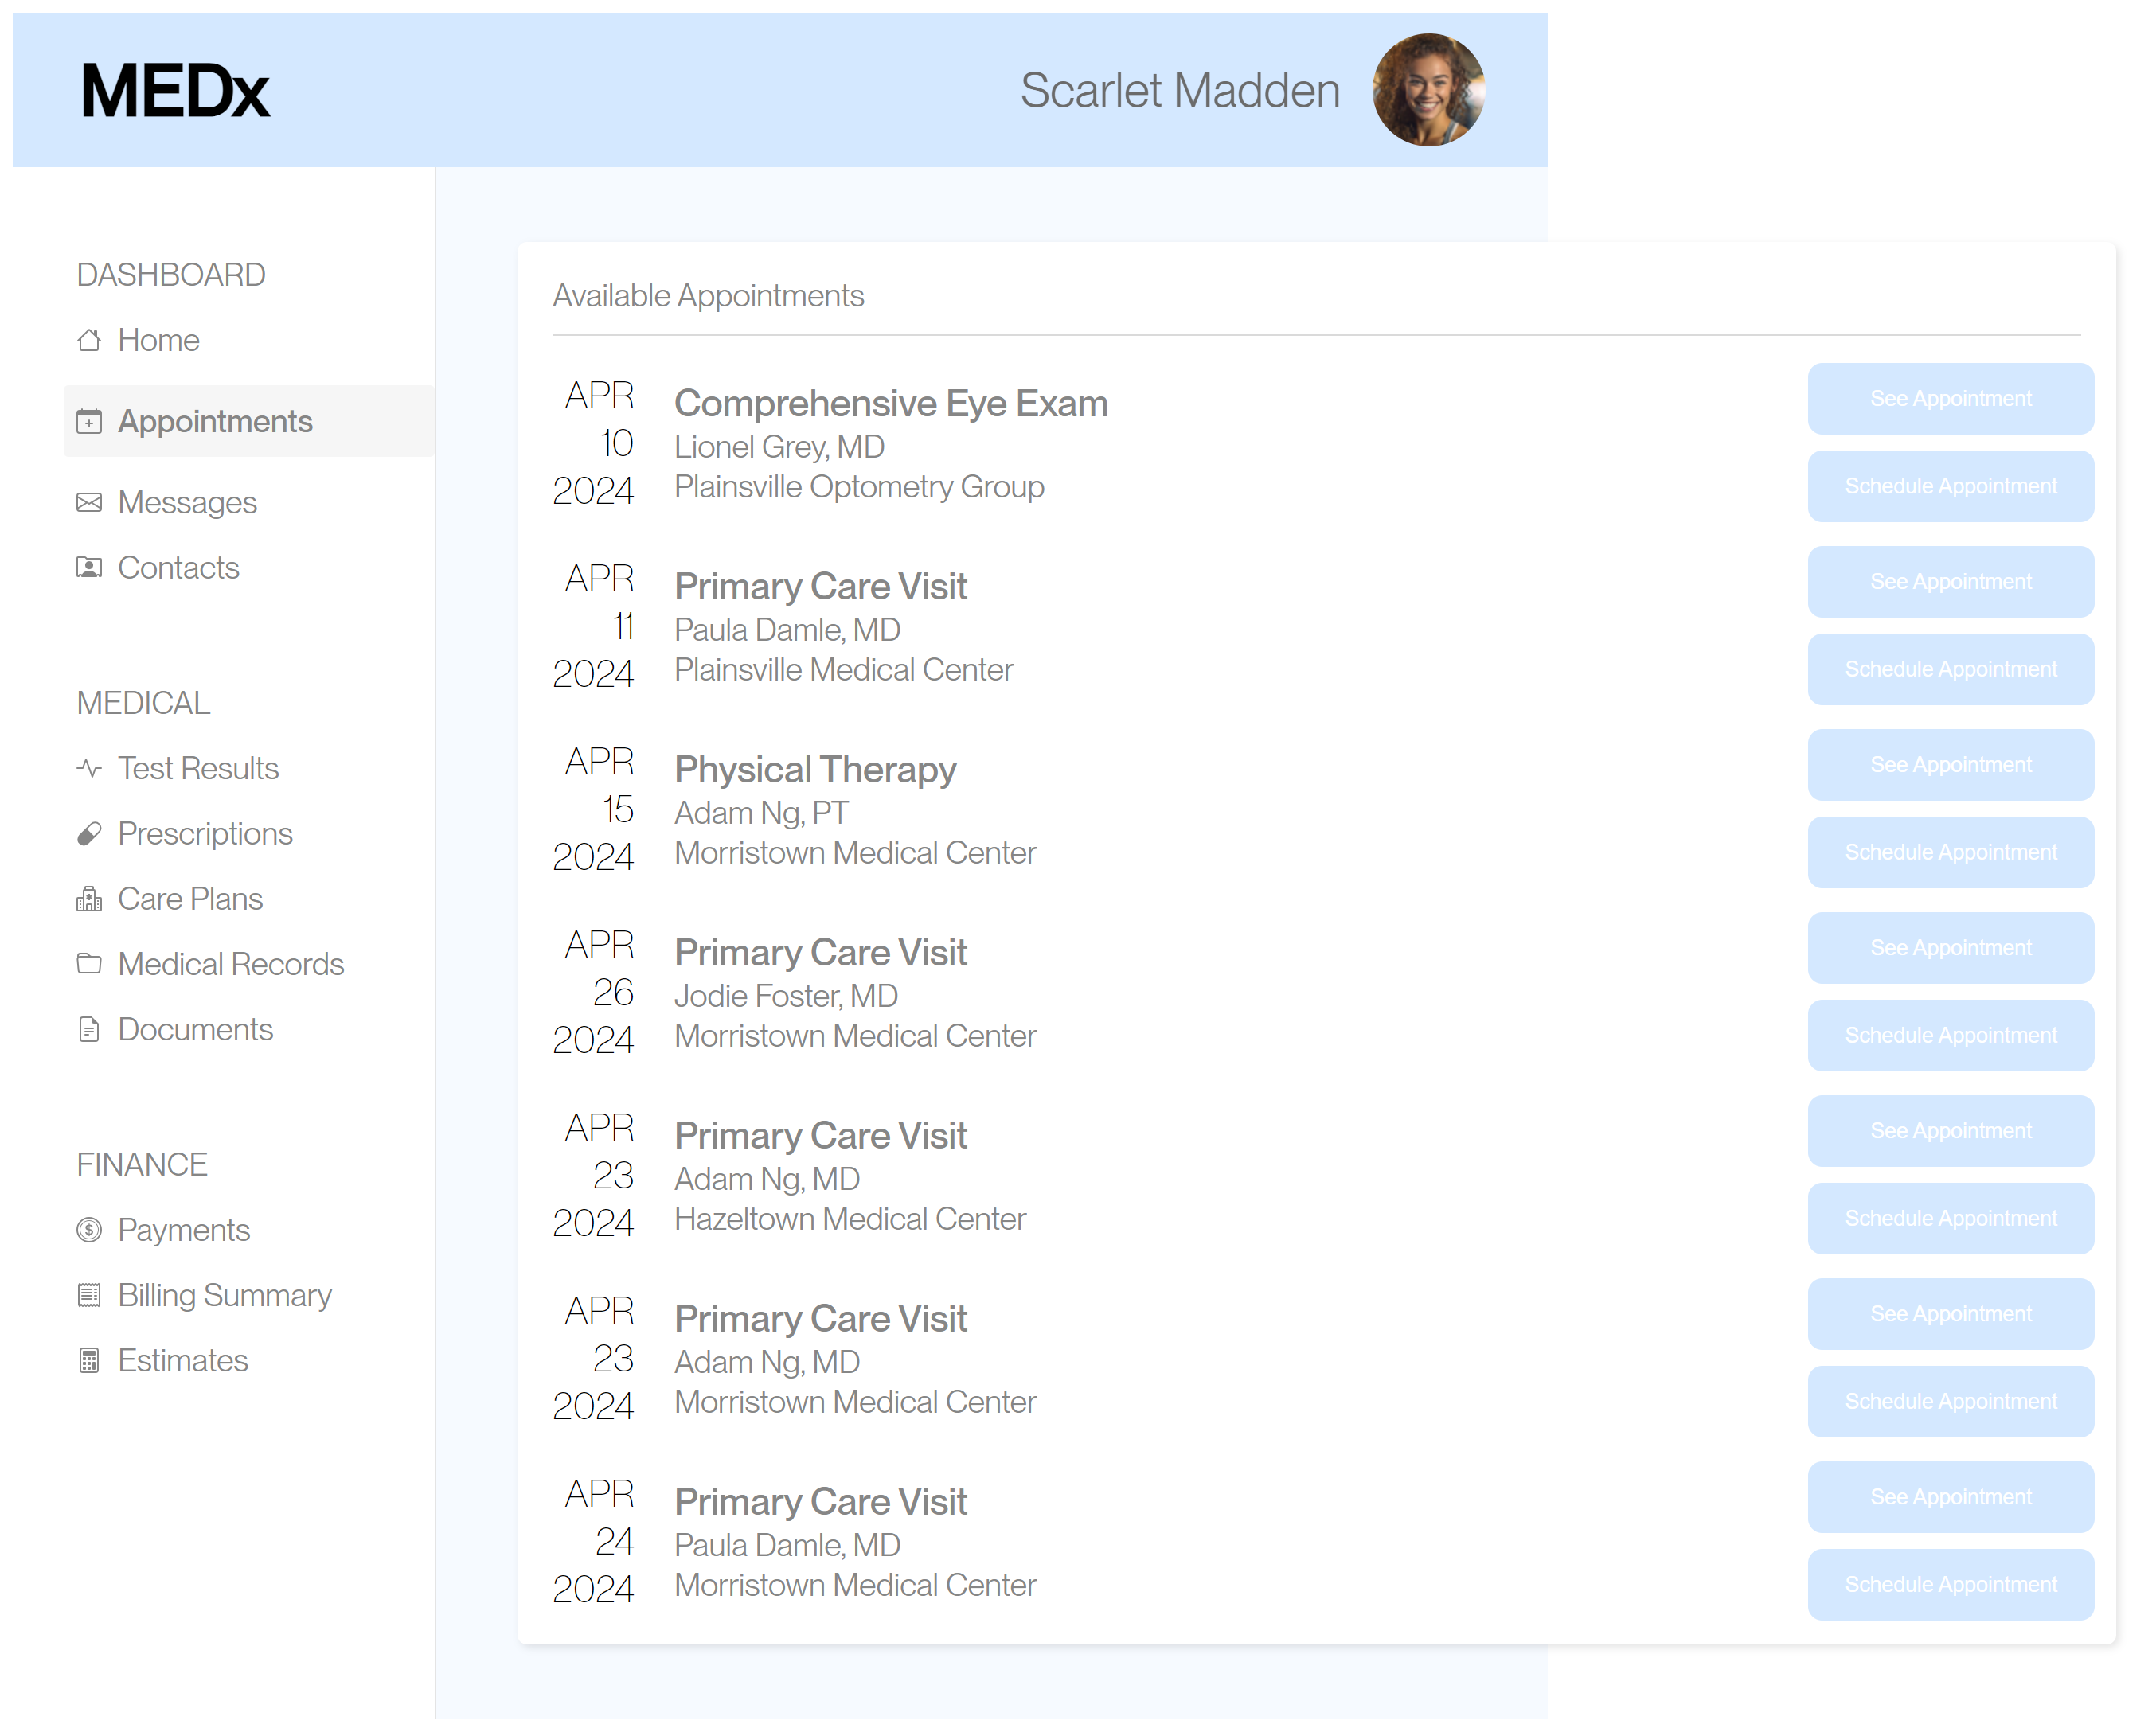
The goal of this assignment is to interpret raw results of a statistical test to form confident conclusions about how two different designs affect user interaction. Given a simple webpage for medical appointments, test participants were asked to schedule an appointment with Adam Ng, MD at Morristown Medical Center on April 23, 2024. They were also asked to complete the task on a different version with small UI changes. To analyze which version performs better in completing the given task more efficiently, user engagement metrics (such as misclick rates, time on page, and mouse move distance) were measured.

Data Collection

Version A

Version B

Changes

  • Made all elements fit within the screen without having to scroll in the x-direction.
  • Made sections for each hospital location instead of listing individually.
  • Changed the font color of the location and buttons to black for contrast
  • Changed the dates to their numerical value.
  • Increased spacing between each appointment.

Version B of the medical appointment webpage.

Metrics & Hypotheses

Misclick Rate

The frequency with which users click something else on the page before finding the correct button for the task.

Null Hypothesis

There is no significant difference in the misclick rate when users used Version A and when users used Version B. I predict the null hypothesis will fail because both websites are organized differently, with Version A prioritizing the type of appointment and Version B prioritizing the location.

Alternative Hypothesis

The misclick rate is significantly lower when users used Version B compared to when users used Version A. Version B sections each appointment by location so I think users are less likely to misclick if there are appointments with the same doctor and type of visit but different locations. I predict users are more likely to misclick on Version A because all the information is just listed out. Since it look like an overload of information, users may just click the first one they see that has part of the information they’re looking for, such as the appointment on April 15 or the appointment at Hazeltown Medical Center instead.

Time on Page

Time spent on the webpage.

Null Hypothesis

There is no significant difference in average time spent on the page when users used Version A and when users used Version B. I predict the null hypothesis will fail because Version A and Version B are visually different in color contrast and spacing, which makes a difference in how users navigate the web page.

Alternative Hypothesis

The average time spent on the page is significantly lower when users used Version B compared to when users used Version A. I predict users will spend less time on the page using Version B because it is easier to find the appointment you want when they’re visually separated into groups and categorized. The contrast and spacing make the page more readable instead of Version A, which has all the appointment information in the same color and all close together. The white font on the light blue buttons in Version A make it hard to read so users may spend a longer time trying to read which button is which, while the black font on the buttons in Version B makes it easier to read.

Mouse Movement

The total distance of the user’s mouse movements.

Null Hypothesis

There is no significant difference in average mouse move distance when users used Version A and when users used Version B. I predict the null hypothesis will fail because the content placement of the appointment information is at different locations.

Alternative Hypothesis

The average mouse move distance is significantly lower when users used Version B compared to when users used Version A. Since Version B is grouped by location, I predict users will move their mouse less because they navigate straight to the appointments at Morristown Medical Center, excluding scrolling through the other locations. Even though it’s the same information, for Version A, users may use the mouse cursor to move across all the information since having everything listed out looks very cluttered.

Statistical Testing

Results

Terminology

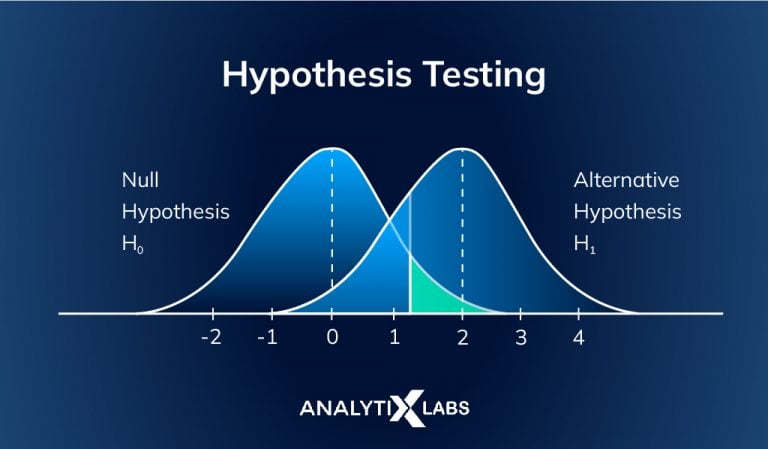
  • One-tailed t-test: tests if x (experimental) number is bigger/smaller than y (baseline) number (continuous).
  • Two-tailed t-test: tests if x number is different from y number (continuous).
  • ꭓ² test: tests if group x frequency is different from group y frequency (categorical).
  • t or ꭓ²: the magnitude of the difference between two groups.
  • df: degrees of freedom; based on the number of participants you have.
  • p: chance that the groups are actually the same.

Hypothesis testing infographic.

Mouse Misclicks

Since misclick rate is a categorical variable (number of misclicks out of total clicks), a chi-squared test would be appropriate. This test is used to determine whether there is a significant association between two categorical variables, in this case, the version of the website (Version A or Version B) and the occurrence of misclicks.

df ꭓ² p-value
1 4.103526475 0.0427938667

Time on Page

Time on page is typically a continuous variable representing the duration spent by each user on a particular webpage. For this metric, a two-tailed t-test would be suitable. This test would help determine whether there is a significant difference in the average time spent on the page between users who were exposed to Version A and users who were exposed to Version B.

Category Milliseconds
Avg(A) 29411.25
Variance(A) 341951899.9
Avg(B) 10466.21429
Variance(B) 14840406.18
Degrees of Freedom 16.47809661
T-score (-abs|A - B|) -4.000011223
P-value 0.0009794302999

Mouse Movement

Mouse move distance is also a continuous variable, representing the distance the mouse cursor travels while a user interacts with the webpage. Similar to time on page, a two-tailed t-test would be appropriate for this metric. It would help determine whether there is a significant difference in the average mouse move distance between users who used Version A and users who used Version B.

Category Pixels
Avg(A) 7337.481313
Variance(A) 30326702.08
Avg(B) 2407.111571
Variance(B) 466564.3762
Degrees of Freedom 15.52657099
T-score (-abs|A - B|) -3.550112316
P-value 0.002775424794

Data Analysis

Misclick Rate

As p<0.05, we reject the null hypothesis and conclude that there is a statistically significant difference in how frequently users clicked the wrong button for Version A and Version B. On the other hand, we find statistically significant evidence that the alternative hypothesis is true. Since the chi-squared value is positive, the observed misclick rates for Version A and Version B are higher than expected. This suggests a positive association between the webpage version and misclick rates, meaning that one version is more prone to misclicks than the other.

Time on Page

As p<0.001, we reject the null hypothesis and conclude that there is a statistically significant difference in the time it takes to complete the task for Version A and Version B. This means there is less than a 0.1% chance that there is no difference between the groups. On the other hand, we find statistically significant evidence that the alternative hypothesis is true. As the average time spent on Version A (29 seconds) is higher than that of Version B (10 seconds), we see evidence that users spend more time looking at the web page for Version A than Version B.

Mouse Movement

As p<0.03, we reject the null hypothesis and conclude that there is a statistically significant difference in how much a user moved their mouse for Version A and Version B. On the other hand, we find statistically significant evidence that the alternative hypothesis is true. As the average distance of the user’s mouse movements on Version A (76 inches) is higher than that of Version B (25 inches), we see evidence that users move their mouse more when looking at the web page for Version A than Version B.

Summary Statistics

In analyzing the data from the A/B test, it's important to mention Version A had 16 data points while Version B had 14. For misclick rates, Version A had a significantly higher rate at 56% compared to Version B's 7%. This suggests that Version B may have a more intuitive or user-friendly design, leading to fewer misclicks. The large difference in misclick rates between the two versions indicates a potentially significant improvement in user experience with Version B. Regarding time spent on the page, Version A had a higher mean (29411.25 ms) and median (26621.5 ms) compared to Version B's lower mean (10466.21429 ms) and median (9671 ms). Interestingly, both versions had a mode in the 10,000 milliseconds. These statistics suggest that users spend more time on Version A, indicating difficulty in finding information compared to Version B, which users spend less time on. As for mouse move distance, Version A had a higher mean (7337.481313 pixels) and median (5468.246 pixels) compared to Version B's lower mean (2407.111571 pixels) and median (2171.6475 pixels). The mode for both versions fell within specific ranges (in the 3000s for Version A and in the 2000s for Version B). This could indicate that users are navigating through more content or encountering more obstacles in Version A compared to Version B.
Next Work

Development

Thanks for messaging!
Contact

Let’s talk.

New projects, work inquiry or even a coffee.

Kiara Vong

First-generation college student from Hawaii.

I'm currently a Software Engineer at Capital One. I got my BS in Computer Science at Brown University. My pals describe me as a caring, reliable, hardworking team player. I'm passionate about interaction, UI/UX, and human-centered design. My driving force is understanding people, having empathy towards the challenges they are presented with, and helping them find solutions through intuitive design and insightful interaction. When I'm not coding, you can find me playing with my foster cats, going on Pikmin Bloom, or watching K-dramas!

  • React.js
  • UI/UX
  • is Fun.
  • Semicolons.